


During 2009, the IT outsourcing and custom software development services providers market was recovering from rising demand for outsourcing services. All countries, excluding the Baltic region (Estonia, Latvia, Lithuania), experienced growth in market volumes at the year-end. In 2009, the overall growth in services exported from the CEE region reached 12%.
The most noticeable trends prevailing in the CEE region include:
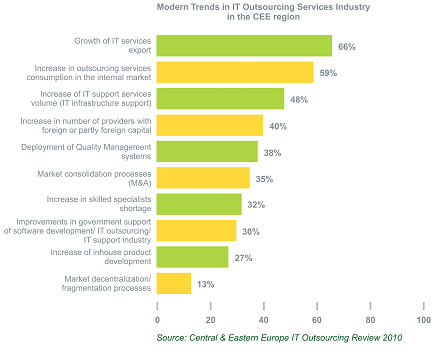
Figure 6. Modern Trends in IT Outsourcing Services Industry in the CEE Region
The figure shows that the majority of those surveyed noted growth in their export services volume. This is partly due to the fact that during the economic recession companies providing IT outsourcing services transferred (“insourced”) some their activities to local firms in their market. This trend was also influenced by local companies with counter-interests in IT outsourcing services (i.e., those finding their own IT services contractors instead of outsourcing). ?? 2009 also witnessed an increase in IT infrastructure and IT infrastructure support outsourcing, which became fashionable as the result of the popularization of technologies such as Cloud computing, virtualization, etc.
It should be noted that trends such as market decentralization/fragmentation, and the development of in-house products by outsourcing services providers, have been declining. The main consumers of IT outsourcing services are middle-sized and large companies. Smaller companies do not often outsource work to other countries, and smaller providers frequently lack the resources to work with larger clients. Both of these factors detract from the development of small-sized companies. A large number of small- and middle-sized businesses in the USA and Europe treat IT outsourcing and the offshore/nearshore model of custom software development with alarm. The entry of countries with developed economies and small- and middle-sized businesses into these segments can generate a large number of contracts for middle- and specifically small-sized companies in the CEE region.
Outsourcing services providers are quite optimistic about their development prospects for 2010. Respondents from all countries forecast 10%-30% growth depending on specific circumstances at work within each individual country.
According to the forecasts of those surveyed, the volume of IT outsourcing and custom software development services exported from the CEE region will reach about USD $5 billion in 2010.
Market Volume
The general volume of IT outsourcing and custom software development services exported from the CEE region reached USD $4 billion in 2009. The largest growth took place in Romania and Ukraine. These two leaders invariably show high rates of market growth and leave other countries far behind in terms of the volume of IT outsourcing services exported. Hungary, Poland, Belarus, Czech Republic and Bulgaria close out the list of leaders. The share of market export volume for all other countries in the region combined is just 17%. The trend of decreasing market export volume shares in these countries, which has been noticeable for the last three years, will most likely continue in 2010 as well.
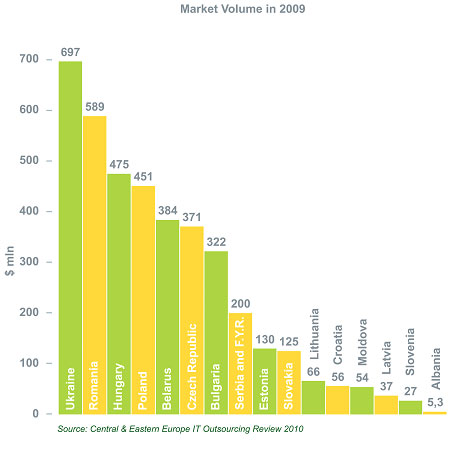
Figure 7. Market Volume in 2009
Note: To calculate the market volume, two independent assessments were used. To determine the first assessment, sources used included the number of specialists involved in the industry of software development and IT outsourcing services; the average rates by country; staff workloads; and the specific amount of offshore projects in the general revenue structures of companies as reported through the surveys. The second assessment of market volume is based on market volumes from CEEOA’s 2008 research, and the growth index of the IT outsourcing services export market in 2009.
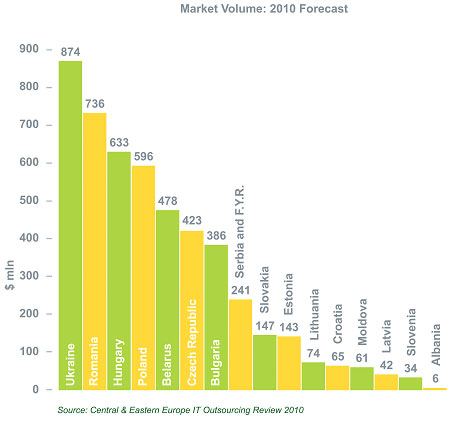
Figure 8. Market Volume: 2010 Forecast
Note: The forecast of market volumes for 2010 was calculated based on the final values of market volumes in 2009, and weighted with the average assessment of revenue growth for 2010 as reported by CEE companies.
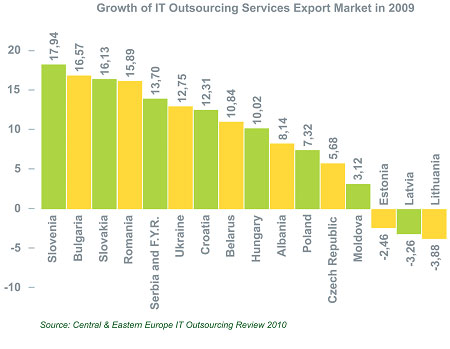
Figure 9. Growth of IT Outsourcing Services Export Market in 2009
Note: Values for the growth of the IT outsourcing services export market in 2009 are factored using the weighted average values for revenue growth in 2009 (inclusive of the companies’ size).
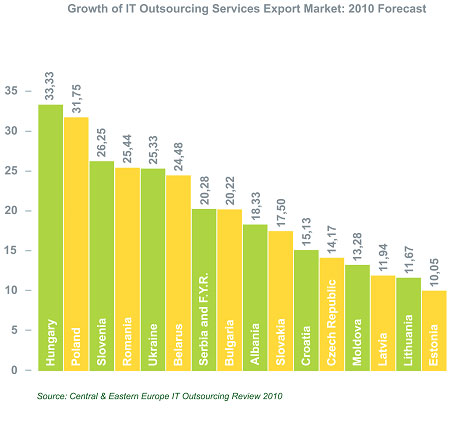
Figure 10. Growth of IT Outsourcing Services Export Market: 2010 Forecast
Note: Values for the growth of the IT outsourcing services export market for 2010 were calculated using the weighted average values for revenue growth expected by CEE companies in 2010 (inclusive of the companies’ size).
Number of Companies
The number of companies operating in the market describe the existing ecosystem of the industry in a given country, and the ease/complexity of setting up a business in the IT outsourcing industry. In 2009, the growth in the number of companies reached 16-17% in Slovenia, Bulgaria, Slovakia and Romania. A growth rate of 10-12% was indicated in Serbia and F.Y.R., Ukraine, Croatia, Belarus and Hungary. In other countries the growth in the number of companies ranged between 3% and 6%.
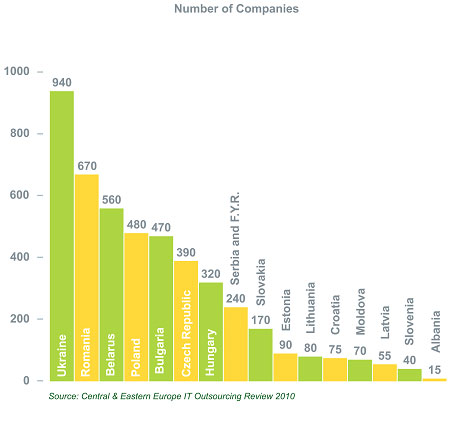
Figure 11. Number of Companies
Note: To calculate the number of companies the sources used were the findings from the 2008 research; answers about the year of a company’s founding; expert assessments of the growth of new business segments; and other analytical resources including data on the number of companies operating in the market.
Number of Specialists
In 2009, the number of specialists slightly increased. This fact led to a prediction of positive growth in the number of specialists for 2010 as well. In 2009, almost 95,000 IT specialists were involved in the IT outsourcing and custom software development services industry in the CEE region. The leading countries (Ukraine, Romania, Belarus, Hungary, Poland and Bulgaria) accounted for 75% of all specialists in the region. Strong engineering schools and large numbers of students in IT specialties have created good prospects for further market development against the backdrop of the recovering global economy and rising demand for outsourcing services.
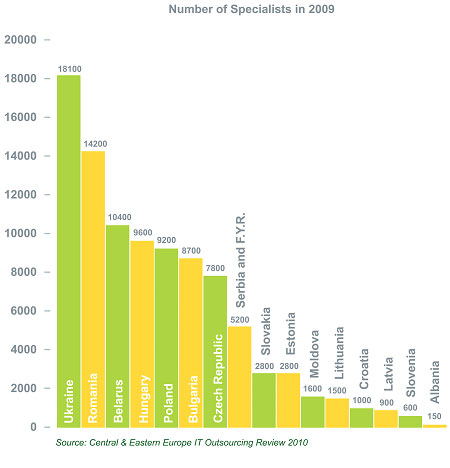
Figure 12. Number of Specialists in 2009
Note: The number of specialists was calculated based on the number of specialists involved in the IT outsourcing and software development market in the CEE countries. This information was provided by the survey respondents with corrections made to the figures based on the data received from national associations and materials from independent analysts.
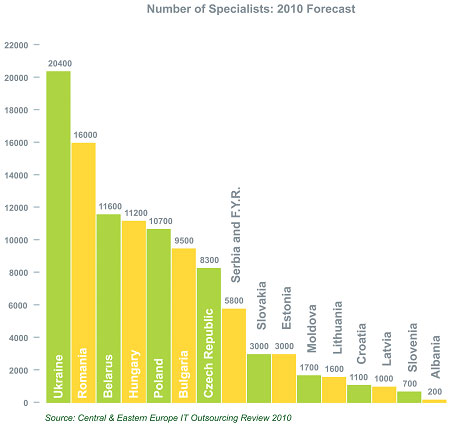
Figure 13. Number of Specialists: 2010 Forecast
Note: The number of projected specialists in 2010 was calculated based on the number of specialists in 2009 weighted by the average assessments of revenue growth expected for 2010. This information was provided by CEE companies with corrections for expected inflation in 2010.
Market Rates
At the outset of 2009, the drop in rates were suspended. For the remainder of 2009 the rates growth resumed for the first time since the global financial crisis began to resolve. The main reason for the increase in rates growth is attributable to rising demand for IT outsourcing services.
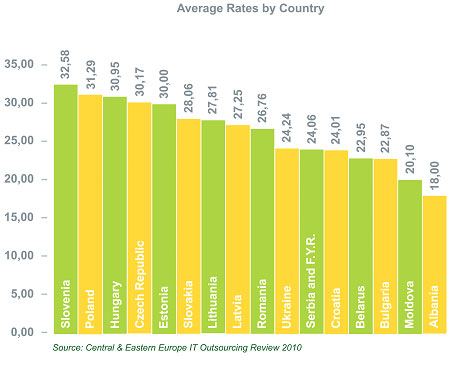
Figure 14. Average Rates by Country
Note: To calculate the average market rates by country the sources used were data on the average rates by positions. The average rates by country were calculated using the following formula: 10% of average rates for a Project Manager in the country; + 20% of the average rates for a Senior Developer in the country; + 50% of average rates for a Middle Developer in the country; + 20% of average rates for a Junior Developer in the country. The average number of members in a typical team used for this formula was ten developers.
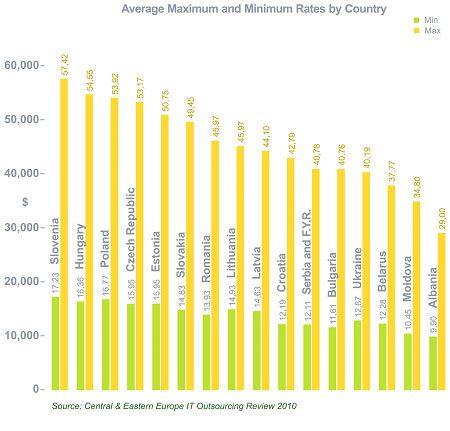
Figure 15. Average Maximum and Minimum Rates by Country
Note: To calculate the maximum average rates by country, the average value of 15% of maximum rates for a Project Manager by country was used. To calculate minimum average rates by country, the average value of 15% of minimum rates for a Junior Developer by country was used.
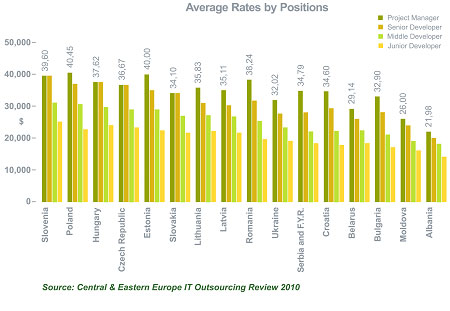
Figure 16. Average Rates by Positions
Note: Information about the average cost for companies to provide their services to clients helps provide an impartial assessment on the volume of projects and expenses regarding collaboration with outsourcing services providers from other countries. The figure below shows the rates for the following specialists: Project Manager, Senior Developer, Middle Developer and Junior Developer. This data was received as an average value of the rates provided by respondents for each of the aforementioned positions.
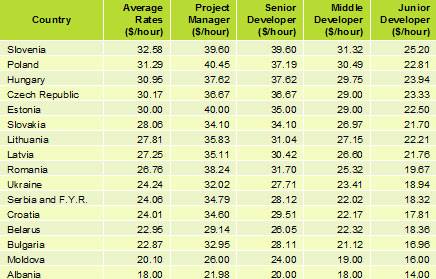
Table 2. Average Rates by Country and by Positions
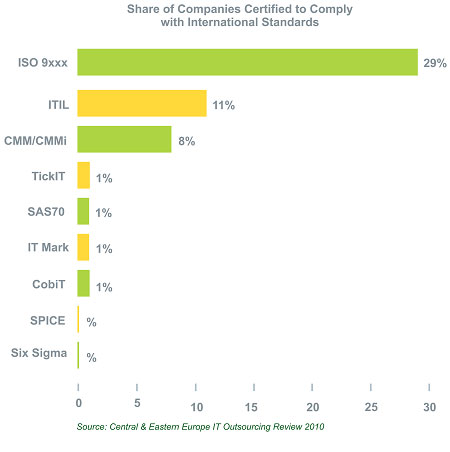
Figure 17. Share of Companies Certified to Comply with International Standards
Note: The findings for this figure were calculated based on a ratio of certified companies as compared to the overall number of technology companies that participated in the survey.


