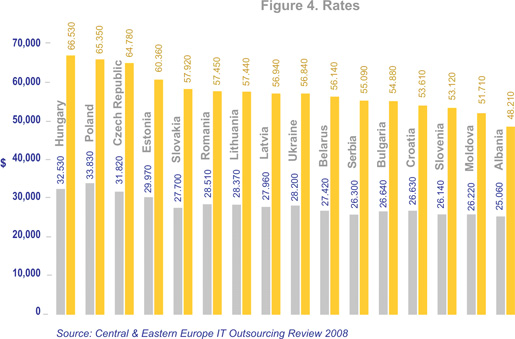
| | $min | $max | | 1. | Hungary | 66,530 | 32,530 | | 2. | Poland | 65,350 | 33,830 | | 3. | Czech Republic | 64,780 | 31,820 | | 4. | Estonia | 60,360 | 29,970 | | 5. | Slovakia | 57,920 | 27,700 | | 6. | Romania | 57,450 | 28,510 | | 7. | Lithuania | 57,440 | 28,370 | | 8. | Latvia | 56,940 | 27,960 | | 9. | Ukraine | 56,840 | 28,200 | | 10. | Belarus | 56,140 | 27,420 | | 11. | Serbia | 55,090 | 26,300 | | 12. | Bulgaria | 54,880 | 26,640 | | 13. | Croatia | 53,610 | 26,630 | | 14. | Slovenia | 53,120 | 26,140 | | 15. | Moldova | 51,710 | 26,220 | | 16. | Albania | 48,210 | 25,060 |
| These are the amounts the end customer pays for the services of an IT specialist annually including salary, taxes, facilities, etc.
An attempt was made to calculate both minimum and maximum annual rates for an IT professional in each of the countries. Findings are indicated in USD. |