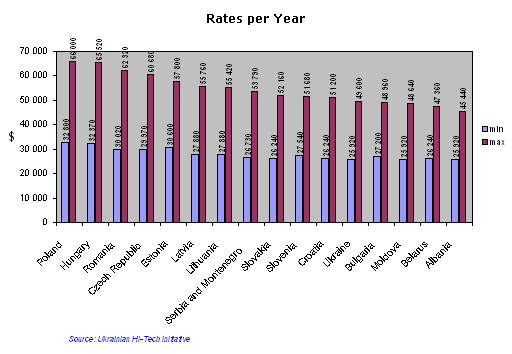
| | $min | $max | | 1. | Poland | 32.800 | 66.000 | | 2. | Hungary | 32.370 | 65.520 | | 3. | Romania | 30.020 | 62.320 | | 4. | Czech Republic | 29.970 | 60.680 | | 5. | Estonia | 30.600 | 57.800 | | 6. | Latvia | 27.880 | 55.760 | | 7. | Lithuania | 27.880 | 55.420 | | 8. | Serbia and Montenegro | 26.730 | 53.790 | | 9. | Slovakia | 26.240 | 52.160 | | 10. | Slovenia | 27.540 | 51.680 | | 11. | Croatia | 26.240 | 51.200 | | 12. | Ukraine | 25.920 | 49.600 | | 13. | Bulgaria | 27.200 | 48.960 | | 14. | Moldova | 25.920 | 48.640 | | 15. | Belarus | 26.240 | 47.360 | | 16. | Albania | 25.920 | 45.440 |
| Annual cost per profess-sional means how much the end customer should pay for the services of one IT specialist yearly. This includes: salary, taxes, office facilities, etc. The attempt was made to calculate both minimum and maximum annual cost per service of one IT professional in each of the countries. Findings are indicated in USD. |


