


Research Objectives
The main objective of this research is to create an annual impartial view of the state of the IT outsourcing services industry in the CEE region. ‘Central and Eastern Europe IT Outsourcing Review‘ is a project of the Central and Eastern European Outsourcing Association (CEEOA, www.ceeoa.org). The study seeks to achieve the following strategic objectives of the association:
Research methodology
Research for ‘Central and Eastern Europe IT Outsourcing Review 2010’ was conducted from February to July 2010. During this timeframe, interviews were held with representatives from large companies operating in the outsourcing services market, outsourcing associations and software development associations in the 16 countries that comprise the CEE region, as well as members of the CEEOA. Executives interviewed were from the following organizations:
To improve the accuracy of the findings in the research, and to extend the base of respondents, the online survey platform ITOlist.eu (www.itolist.eu) was launched, and the survey form extended.
The survey form consisted of the following four main sections and subsections:
Brief profiles of the responding companies, and full profiles of the leading companies from the CEE region, are published in the ‘List of Respondents’ section of the report. The profiles include direct links to the companies’ full profiles in the ITOlist.eu catalogue.
Research Respondents
Respondents include 246 companies that participated through online surveys; verbal interviews with representatives from 32 companies and 25 representatives of associations, as well as answers provided by market experts on the market volume assessment and the main development trends in the IT outsourcing industry in the region. The results of the survey reveal that nearly 4,500 companies operate in the industry of IT outsourcing and software development services in the 16 countries of the CEE region. More than 6% of market players were surveyed, with respondents completing an average of 95% of the survey. The high level of responsiveness from a large number of companies demonstrates the representative strength of the data , which has an error variance of just 3%.
Number of respondents by country:
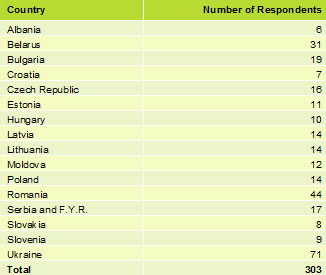
Table 1. Number of Respondents by Country
Summary Findings
Market Volume
One of the most important factors in the region’s market development and growth is the market volume indicated in the financial indices. Our research indicates that this key factor is the market volume of services exported in each of the countries examined (see Figure 7. Market Volume in 2009).
The estimate of the volume of IT outsourcing services exported is based on the companies’ average rates for IT outsourcing services, the number of employed specialists in the industry, employment efficiency for offshore projects, and the workload of personnel in commercial projects. When calculating the final values, other sources used include data from online surveys and verbal interviews of representatives of the companies, combined with the opinions of market experts and data received from national associations.
The most prevalent trend in 2009 was the increase in the volume of IT outsourcing services provided. The volume of work exported in 2009 indicated a noticeable growth in comparison to the findings of the ‘CEE IT Outsourcing Review 2008’, ranging between +24% in Belarus and +44% in Romania. The exclusion to this trend were the Baltic countries, which experienced a slight decrease in market volumes (see Figure 9. Growth of IT Outsourcing Services Export Market in 2009). Such fixed growth resulted from two components. The first is an increase in the number of respondents for the 2009 report, which resulted in more precise data. The second component is the growth of market volumes. The actual growth in the number of specialists in the industry ranged between +4% and +6%, and the actual growth in service rates ranged between +3% and +7%, respectively, in comparison with the findings of the 2008 report.
It should also be noted that there was a slightly higher rate of errors in calculations for the findings for countries with small volumes of exported services such as in Lithuania, Croatia, Moldova, Latvia, Slovenia and Albania. The higher rate of error is related to the fact that the markets for custom software development and IT outsourcing services in these countries are somewhat immature. In these countries, the processes of market development are currently more fluid and random.
Number of Companies
The market development process is defined by the number of companies operating in a given country’s market. Developed markets are characterized by a substantial share of large companies with a sizable number of specialists employed and volume of services provided.
The financial crisis of 2008 proved a powerful incentive that led to the establishment of a significant number of new companies over the last year. In fact, 20% of responding companies were established during 2008-2009 (see Figure 1. Share of Companies by Year of Founding). These were mainly small-sized companies established in times of negligible redundancy at the end of 2008 through the beginning of 2009. Many of these companies also were the result of business restructuring when service companies shifted to independent organizations.
Among the leading countries, Belarus reported a minimum growth of +10% in the number of new companies formed, with Bulgaria achieving the highest growth of +17%. Average growth in the region reached 10% (see Figure 2. Growth in Number of Companies in 2009).
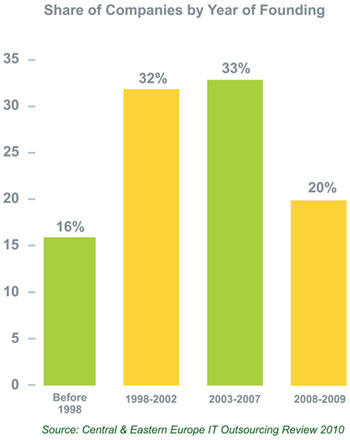
Figure 1. Share of Companies by Year of Founding
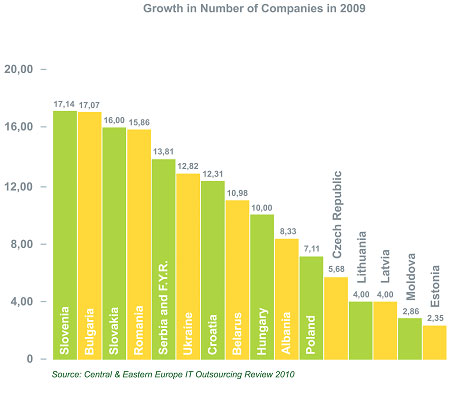
Figure 2. Growth in Number of Companies in 2009
Newly established companies were primarily small-sized and operating in new market segments such as mobile development, software testing services and web development. The appearance of new companies did not influence the overall market structure. A significant number of respondents, 38% versus 9%, supported a continuation of the trend of further market consolidation (see Figure 6. Modern Trends in IT Outsourcing Services Industry in the CEE Region). Figures on the percentage of companies by size, as measured by number of employees and number of employed specialists, (see Figure 3. Share of Outsourcing Companies by Number of Employees and Figure 4. Share of Employed IT Specialists in the CEE Region by Company Size), indicate considerable consolidation of CEE market resources into large-sized companies:
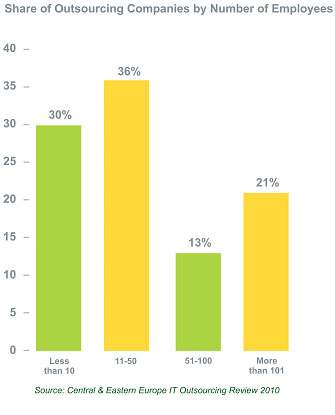
Figure 3. Share of Outsourcing Companies by Number of Employees
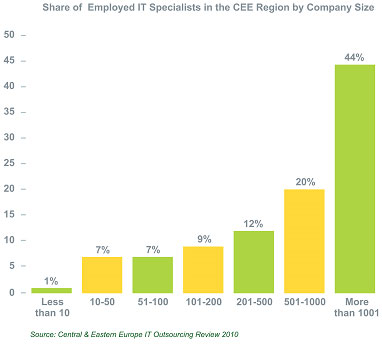
Figure 4. Share of Employed IT Specialists in the CEE Region by Company Size
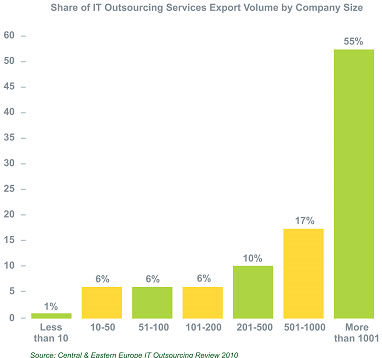
Figure 5. Share of IT Outsourcing Services Export Volume by Company Size
Many respondents noted that the slump in business profitability is one of the indicators of market maturity and a factor favoring the companies’ growth and market consolidation process.
Number of IT Professionals
Another important indicator regarding the development of the outsourcing services market is the number of specialists involved in the industry. This is because the volume of services provided is directly proportional to the number of specialists employed.
The higher education and comprehensive schools that formed the base of educational systems in former Soviet Union countries were mainly focused on engineering specialties. This legacy, and the presence of strong science schools, fueled the rapid increase in the number of companies providing IT outsourcing and software development services in the CEE region. Educational systems in CEE countries are improving on their already strong focus on fundamental engineering education. This is one of the most important factors contributing to the preparation of qualified specialists in the industry.
The 2009 year trends illustrate a continuing increase in the number of employed specialists working in the CEE market. The migration of technical specialists to the countries of Western Europe and North America, as well as some technical specialist changing professions, are having a negligible effect on the ongoing growth in the number of specialists in the region. The primary source of new specialists are high school and university graduates. However, it must be noted that the significant potential of high school graduates with educations in IT specialties are not being fully used. For example, in Ukraine, of 14,000 IT graduates only 3,000-4,000 are employed in companies that provide professional IT services. This number could easily double if the government of the Ukraine helped foster more favorable conditions for IT outsourcing business development.
In 2009, the number of IT specialists employed in companies providing IT outsourcing and software development services in the CEE region reached 95,000. Romania led in growth in the number of IT specialists with 12.33 %; Ukraine followed with 9.51% growth.
Rates
The data suggests that the costs associated with providing IT outsourcing services from CEE region companies are not very sensitive to the weak overall economic situation. This is due to the fact that a significant component of the cost of services is labor; and during the economic crisis labor costs remained at nearly the same level as 2008. At the end of 2008 and into the beginning of 2009, the service rates charged by companies dropped slightly in order to retain current clients and to win new projects with the resources available. But since Spring 2009, this, combined with increased demand for services, led the growth in rates to resume.
The usage of a detailed online survey allowed CEEOA to gather enough information to calculate the average rates by countries, and rates by several qualification levels including: Project Manager, Senior Developer, Middle Developer and Junior Developer. Specialization was not taken into account. The question from the survey regarding rates by specialization was: “C.2 What is the average cost of man-hour for standard project in your company (in USD)? Project Manager, Senior Developer, Middle Developer, Junior Developer.” The average rates by country were calculated using the following formula: 10% of average rates for a Project Manager in the country; + 20% of average rates for a Senior Developer in the country; + 50% of average rates for a Middle Developer in the country; + 20% of average rates for a Junior Developer in the country. The average number of members in a typical team used for this formula was ten developers.
Rates are calculated based on the amount the end customer pays for the services of an IT specialist per hour, inclusive of salary, taxes, facilities, etc.
The data on the company rates are included in the following figures:


